When you log in to the portal, you will no longer see the cockpit – as it was previously called – but the dashboard.
In the standard view, this is structured in the same way as the cockpit, but the look has been modernized. With this dashboard, you can now decide for yourself what you want to be displayed and how.
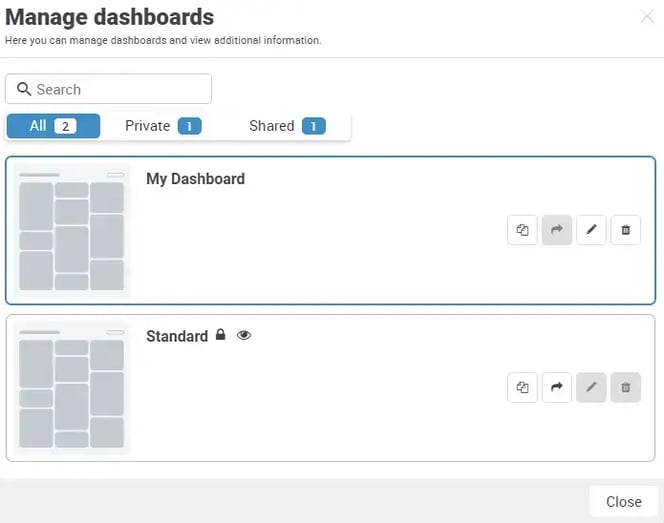
Using the standard dashboard
The standard dashboard cannot be changed and is the same as the previous cockpit view.
Create your own customized dashboard
Click on the three dots to the right of Standard under the Manage button. You will now see a selection where you can select + Create new dashboard.
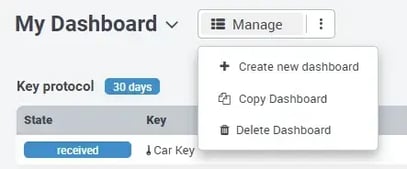
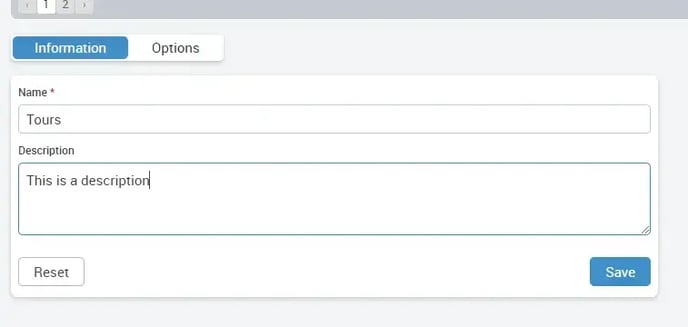
In the next step, you must give the dashboard a name; alternatively, you can also create a description for the dashboard.
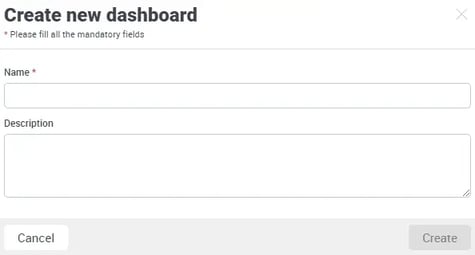
After clicking on the Create button, you will see your new, but still empty dashboard.
![]()
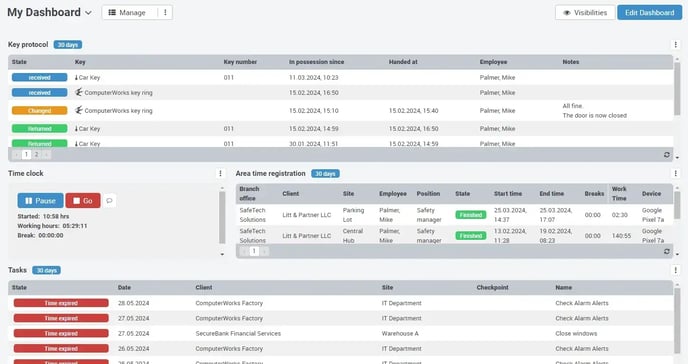
Now click on Edit dashboard and you will see the following view.
![]()
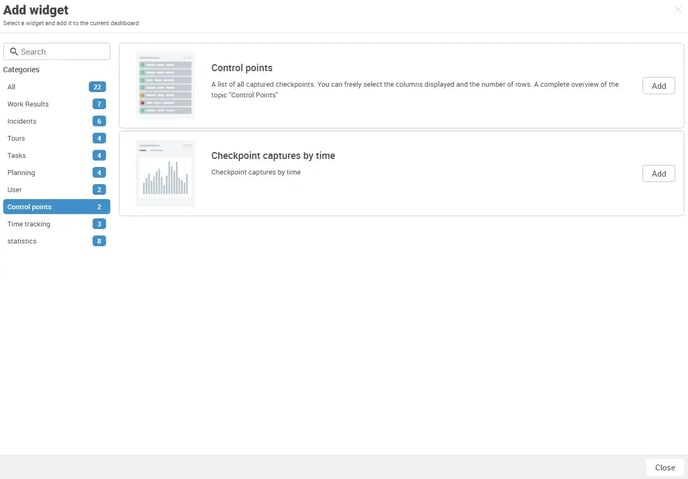
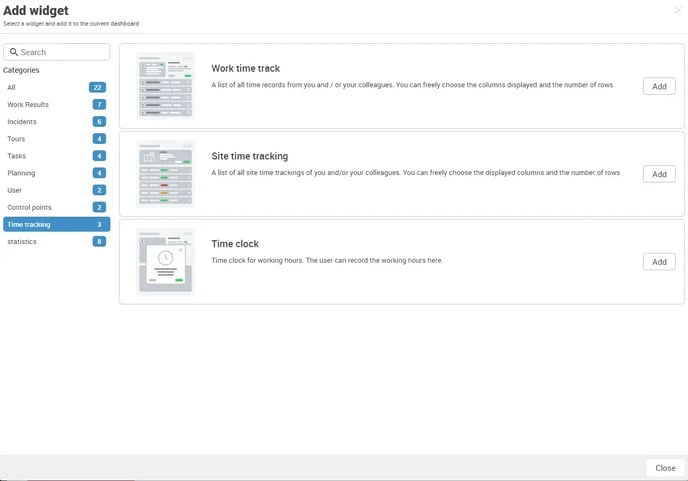
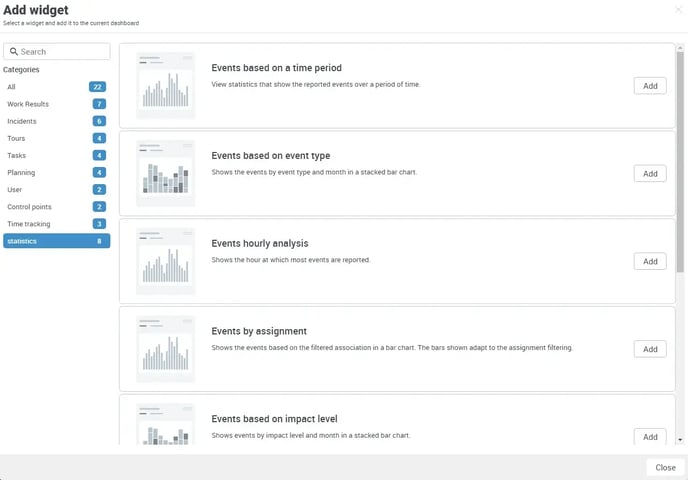
Now click on + Add widget to access the overview of available widgets.
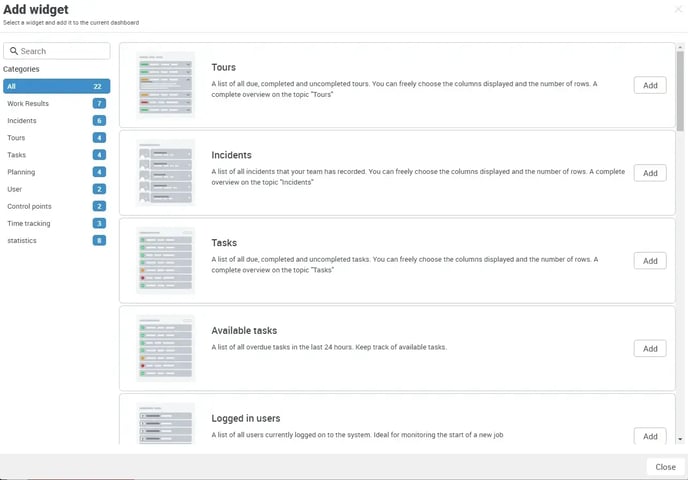
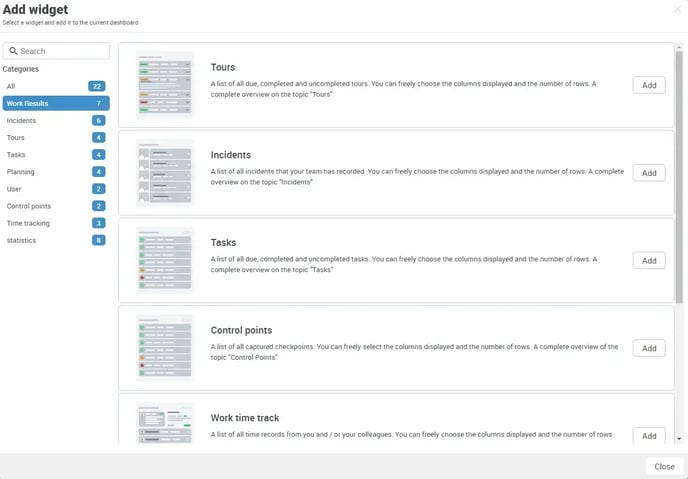
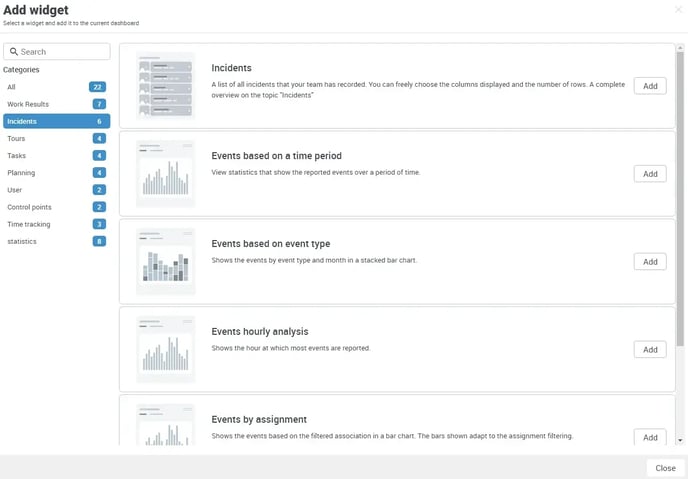
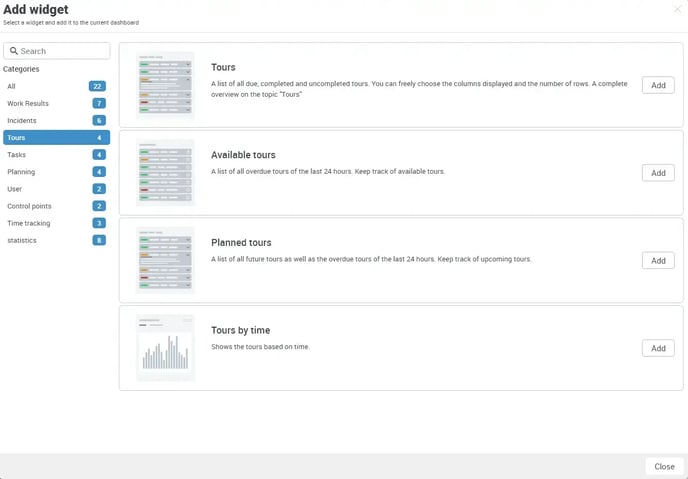
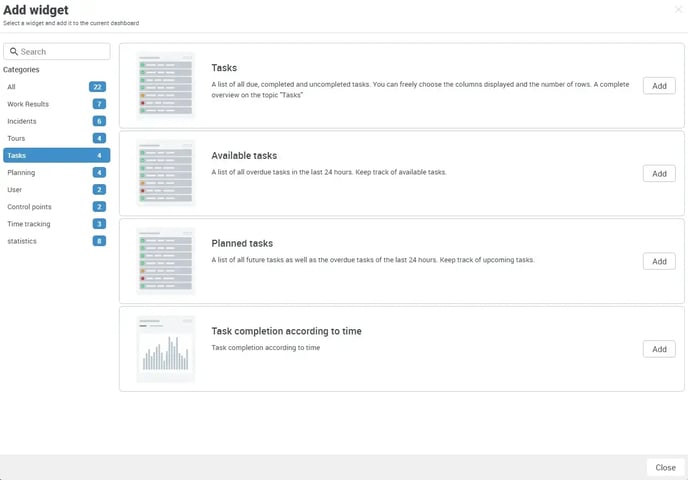
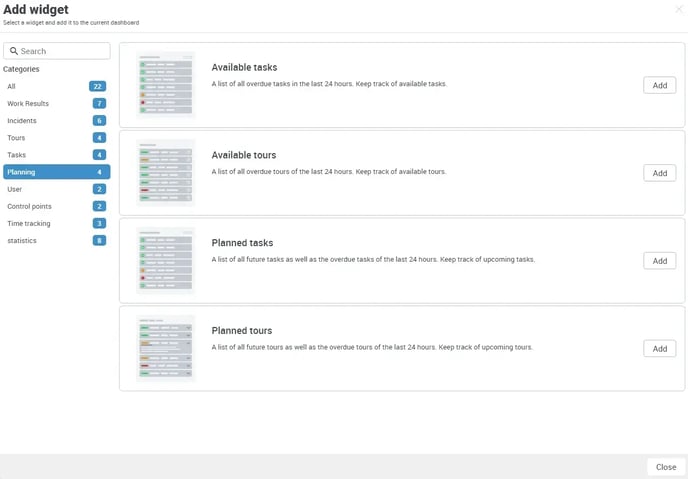
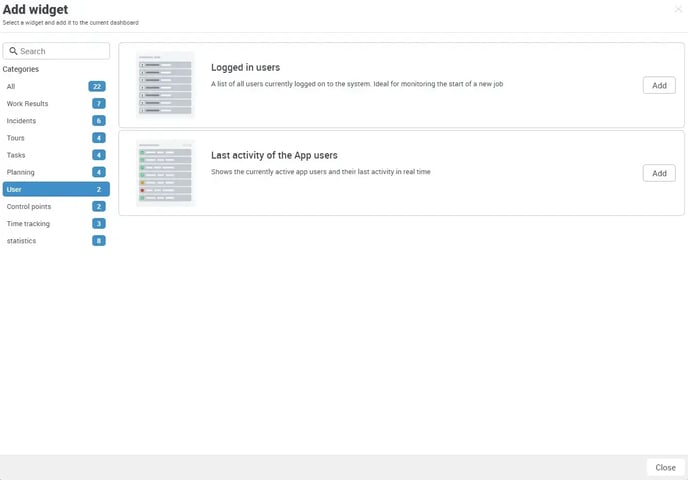
All available standard widgets are listed under All; you can see which ones these are in detail on the right-hand side.
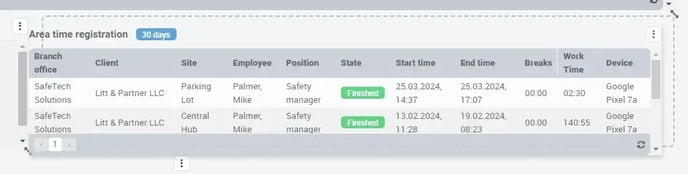
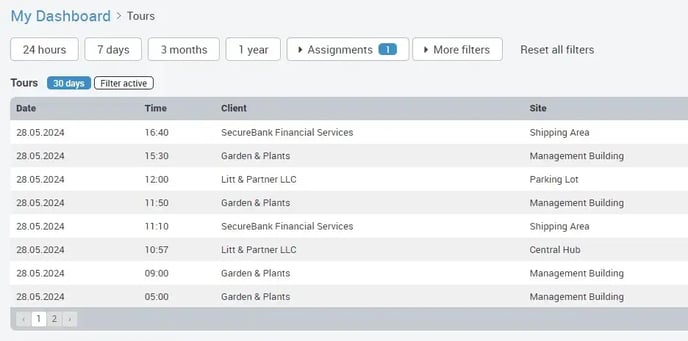
Working hours widget
The working hours widget is now available and can be added to the dashboard. It displays the working times of employees and can be configured as usual. It also reacts to real-time events and shows immediately when employees clock in/out.
Work Results
Incidents
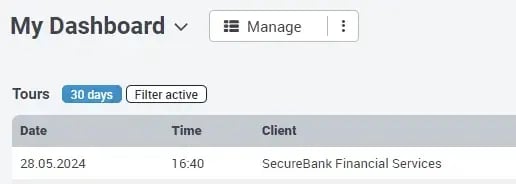
Tours
Tasks
Planning
User
Control points
Time tracking
Statistics
Simply click on Add at the desired widget and when you have added all the desired widgets, close the pop-up window by clicking the button at the bottom right or the X at the top right. 
At this point, you can now adjust the size of the individual widgets. To adjust the height and width of a widget, move the mouse pointer over the bottom corners of the widgets and arrow symbols will appear to the right and left under the widget, click and hold these corners to drag them to the desired size. To change the order of the widgets, click on the top edge of the widget, hold it and drag it to the desired position. A dashed line is displayed where the widget is then positioned.
Once you have adjusted the size and order of the widgets, please click on Save dashboard.
To customize the widgets to your wishes, please click on the symbol with the three small dots on the right above the widget and then on Edit widget.
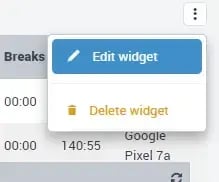
Here you are in the view where you can edit the widget.
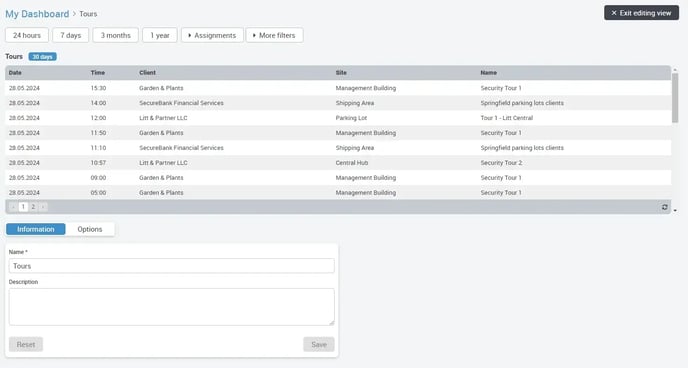
As a user, you can further specialize your widgets in the dashboard to adapt the information displayed to your needs. The widgets specify which filters are available to them. You can see the filter options in the top line:
The following filters can be used for the widgets:
- Tours: time period, master data, employees, status, tours
- Checkpoint scans: Period, master data, employees
- Incidents: Period, master data, employee, status, event type
- Tasks: Period, master data, employee, status, task, form
- 24 hours: Shows only the results of the last 24 hours
- 7 days: Displays only the information from the last week
The filters can be set and saved in the editing view of widgets. In our example, we are filtering the events. For the assignments, you can select the customer or area from which you want to display information. Multiple selection is also possible.
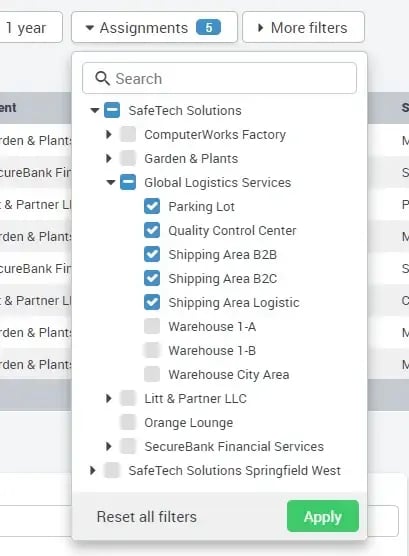
If you do not select anything, all data will be displayed company-wide, unless your account is assigned to a specific customer/area, in which case you will of course only see this/these customer/area(s).
The assignment is saved automatically and is active immediately. You can also define which events, by which employees and with which status should be displayed.
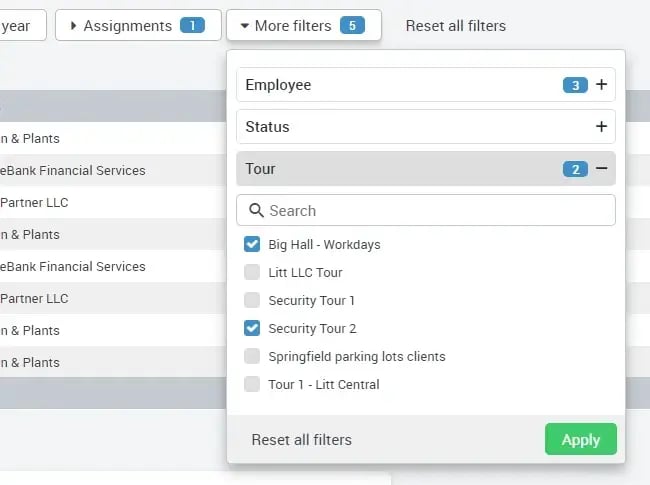
If you do not set any filters, all results will always be displayed. Once you have set all filters according to your criteria, please click on the green Apply button below the filter list and your filters will be applied and saved immediately.
The filter will also be saved the next time you log in. By clicking on Reset filter you will see all information unfiltered again.
Under Information, you can change the name of the widget and enter a description for this widget. If you click on Options, you can see which columns are included.
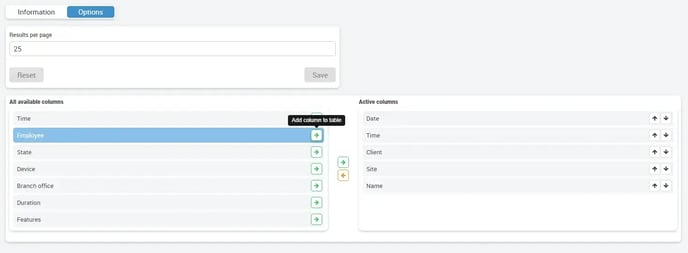
Here you can customize which columns you want to be displayed. Click on the green arrow symbol on the right behind the entries in the list on the left-hand side to add a column.
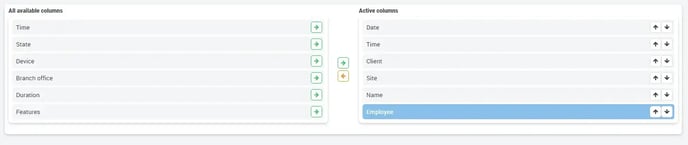
Or remove an entry from the list on the right by clicking on it and then clicking on the yellow arrow symbol between the lists to remove the entry from the widget.
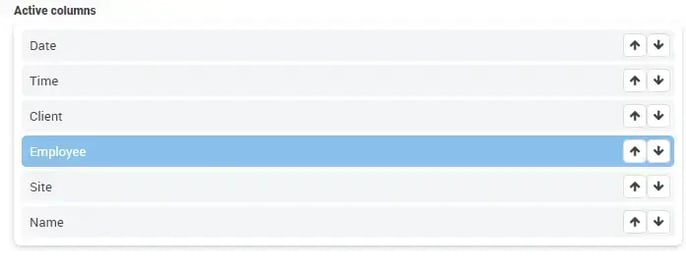
You also have the option of customizing the display so that the order of the columns is displayed in the order that seems most important to you. To do this, simply click on one of the arrow symbols to the right of an entry and the entry will be moved one line in the direction in which the arrow you clicked on points. This change is applied directly and immediately while editing. You do not need to save it again. Once you have made all your adjustments, please click on the black button at the top right and you will see the overview again, in which you can now continue to adjust the widgets individually.
Dashboard selection
To ensure that your own dashboard is displayed immediately when you log in, you must save it as a favorite. You do this by clicking on the name of the dashboard at the top left and then activating the star next to the desired dashboard. This will be saved and your desired dashboard will always be loaded and displayed when you log in.
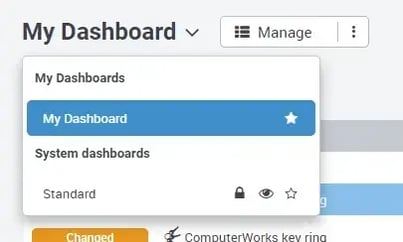
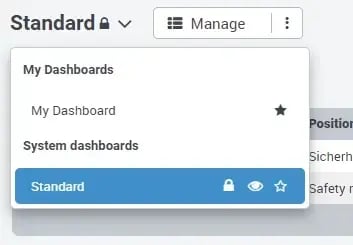
You can check which dashboard is active by simply clicking on the name of the dashboard.